Analyzing the Grid: Peeks and Inrush Currents
Often, we find customers analyzing the graphs and wondering what happens when the energy meter current goes over the grid limit. In this article the most common questions are answered.
Overview
Electric vehicles are just one of the many energy consumers on a site. They might be one of the largest energy consumers, but their behavior is relatively predictable. Other energy consumers can be a lot noisier in their energy usage profile. This is common for machines, boilers, heat pumps, air conditioners and many more devices. Basically, any device can start and stop consuming electricity at any moment. Edge has the responsibility to keep the total energy consumption on a given location below the limits, which Edge can do as long as the total unregulated load (load excluding EV's) stays below the grid limit.
Spikes
If an unregulated energy consumer is suddenly turned on while Edge is loadbalancing near the limit, the limit will be exceeded for a short amount of time. It is the responsibility of Edge to react fast when needed.
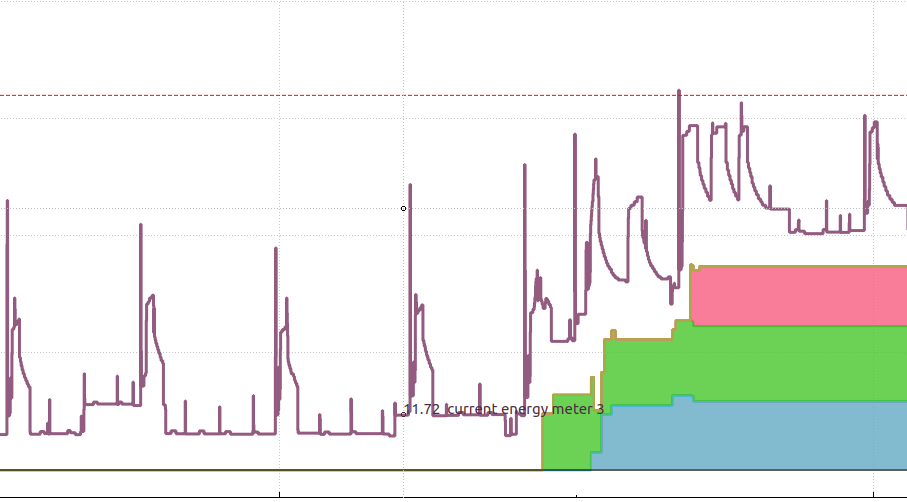
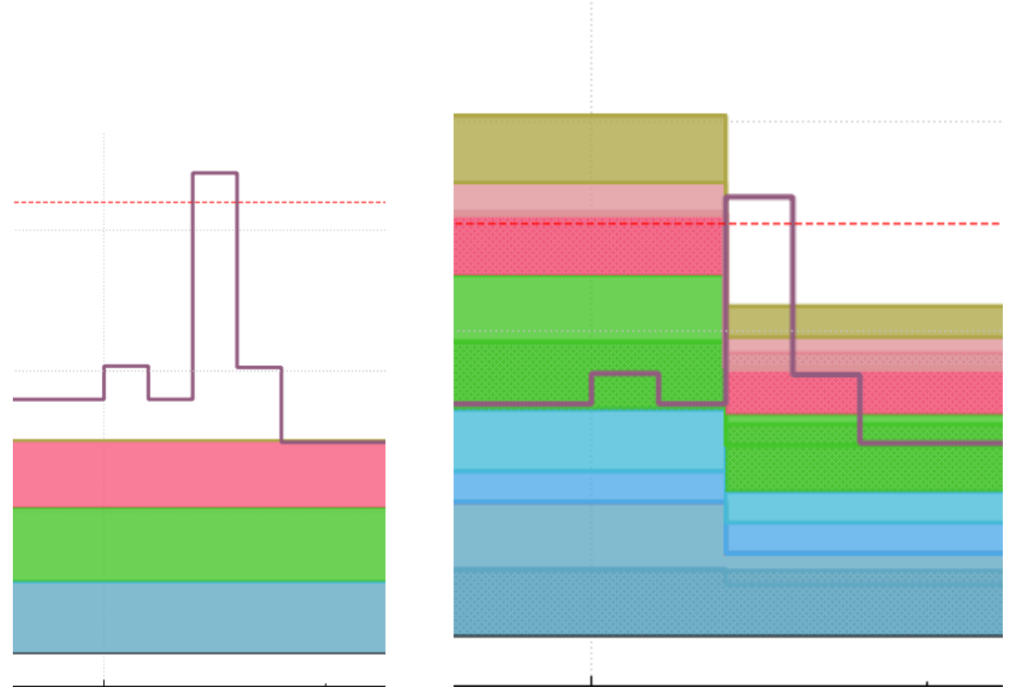
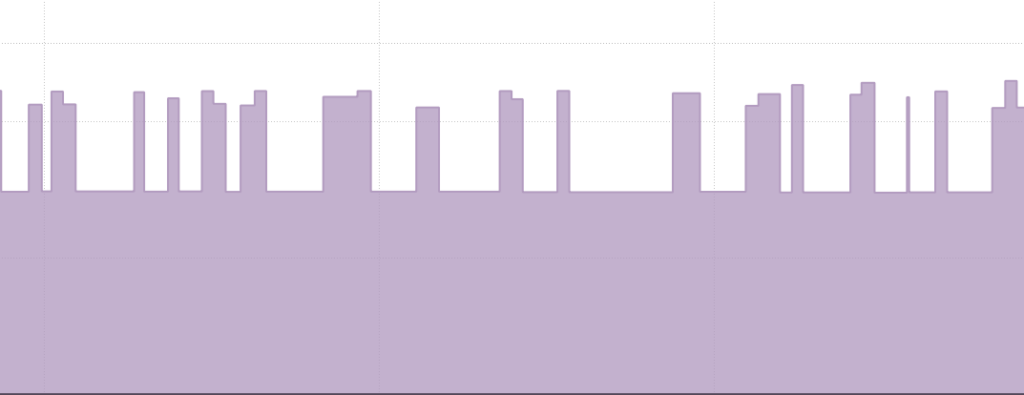
Refer to the following images, they are both from the same scenario where the current of unregulated devices suddenly increased which caused the energymeter to exceed the configured limit. In the first image it looks like Edge is not responding at all because the current of the EV's remain the same. However, in the second image, the same event is shown with the "Current + Setpoint" graph. This graph shows how much current all chargepoints can use. It is clear that Edge responded immediately, but the feedback from the charger can take up to a minute. (Often <10s). The main takeaway is that the spike did not last more than a second. This can be seen because the current from the energymeter started dropping as soon as it went above the limit.
Does It Matter?
The real-time graphs of Edge show very detailed data. Some of this data is sampled more than once a second. This exaggerates the peaks compared to some visualizations of other products and dashboards that only show 1–5 minutes averages where these peaks are not seen. These peaks are no hazard, circuit breakers are there to prevent cables and transformers from overheating, little peaks from a few seconds do not cause overheating. Circuit breakers and fuses are made with this in mind. They will only break during short circuits or when the limits are structurally exceeded for a longer amount of time.
For contractual limits, these are often evaluated as average over a certain interval of time. For example, it might be that you exceed your contracted limit if the average power measured over 15 minutes exceeds the contractual limit. Going 10% over the limit for 2 seconds will not cause any issues with your energy supplier.
How Does Edge Deal with Limits
Edge is designed to deal with fluctuations in the grid. To not repeatedly exceed the limit, Edge has a memory of fluctuating power and will reserve some current when more peaks are expected. When the user power reaches the limit Edge will take it slow and will not directly use all available current as this often leads to exceeding the limit repeatedly.
On the other hand, the Edge loadbalancer intentionally might not ramp down immediately when the limit is exceeded a bit, because Edge knows little peaks do not cause any harm. Edge will internally evaluate the amount and duration exceeded, comparable to how a fuse would heat up. These mechanisms can be adjusted in the grid configuration by configuring the fuse type setting.
Oscillating Chargers
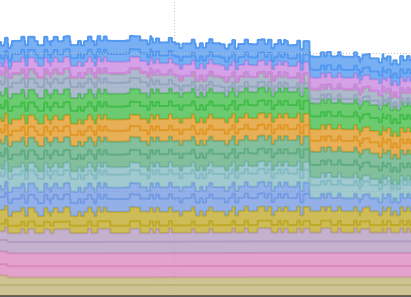
If the graphs look noisy, this might be because a single EV or a single charger does not charge at a constant rate. Since the power visualization graphs are stacked the entire graph will look messy if a single charger at the bottom of this stack is oscillating, this is not a real problem, however it might be worth it checking the cause of the oscillation by switching to the "Current+setpoint" graph, and verifying if the oscillations are caused by Edge (the Setpoint will be oscillating), or if it is caused by a charger (the setpoint is constant, and the charger is oscillating).
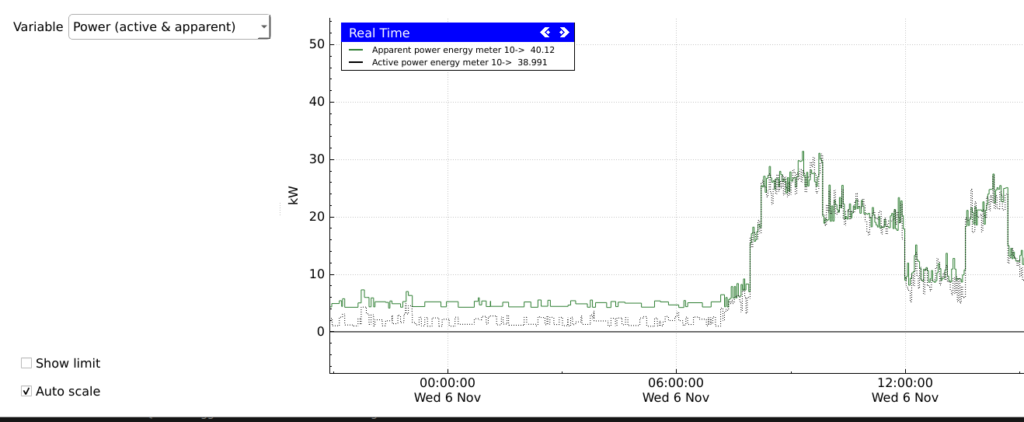
Apparent vs Active Power
With AC power, there is an interesting concept of Power factor, which when not known leads to confusion about apparent power and active power that we both read from the energy meters. This results in two slightly different readings of power. Here is a (very) short explanation. Some energy consuming devices have capacitive or inductive properties, which causes power to move back and forth through the cables. This power moves through the cables, but it is not consumed. This is called Reactive power. Oppositely, power that is consumed is called Active power (kW). Active power is what you will see back on your bill every month. Now active power and reactive power together is called Apparent power (kVA).
In the grid configuration you can select whether your power limit should be based on Active power (contract limits usually), or Apparent power (strain on fuses and cables).
If you have chosen active power, please note that most graphs in EdgeManager show apparent power, when comparing the energy meter power against the configured limit you might be comparing different units.